Performance Highlights June 2021
-
Industry Snapshot:
The Australian private equity and venture capital (PE/VC) industry is
significant, with $30.3 billion of capital raised to date. In 2Q21, the
industry continued to deploy capital into Australian and New Zealand
companies and distribute capital back to investors. In aggregate over
the 3-month period ending June 2021, the industry invested
approximately $275 million and distributed more than $1.1 billion, net
of fees, back to investors, while the value of unrealized investments
increased by $630 million.
-
Strong Long-term Performance:
Australian PE/VC continues to demonstrate strong long-term net of fees
performance for investors, outpacing the ASX 300 and the ASX Small
Ordinaries for the 5, 10, and 20-year periods ending 30 June
2021—tracking between +4.8% and +10.0% ahead of the listed markets.
Long-term performance of the local market (over 20 years) remained
ahead of global peers, while mid-term performance (over 5, 10 years)
lagged.
-
PE/VC COVID-19 Recovery:
Australian PE/VC performed strongly over the trailing 1-year period,
and has outperformed the ASX 300 and ASX Small Ordinaries by 8.9% and
11.1% respectively year to date. Relative to global peers, Australian
PE/VC performance was slightly mix, outpacing Developed Asia but lagged
the US over the trailing 1-year period.
Industry Snapshot
The Australian PE/VC index represents a well-established asset class that
has invested significant capital for LPs and returned strong net
distributions. At the conclusion of Q2 2021, the Cambridge Associates
Australian PE/VC Index represented $30.3 billion raised by 109 PE/VC funds.
Over the 20-year period of data captured by the index, the industry has
invested $26.0 billion (+$275 million in 2Q21) in Australian and New
Zealand companies, returning $30.7 billion (+$1.1 billion in 2Q21) net of
fees back to investors and holding unrealized investments valued at $12.5
billion (+$630 million in 2Q21). The universe is historically dominated by
buyout and growth equity strategies, representing 93% of total
capitalization, while venture capital funds represent 7% of the index.
Historically, buyout and growth equity funds provided nearly 95% of the
distributions to investors, with venture capital representing close to 5%
of distributions. By net asset value as at 30 June 2021, buyout and growth
equity accounted for 77% of the index, with 23% in venture capital.
Long-Term Performance Remains Strong
Over longer periods, Australian PE and VC returns showed continued strong
long-term performance, delivering double digit net of fees returns over 5-,
10-, and 20-year periods (Figure 1). Over these same periods, Australian
PE/VC managers in aggregate demonstrated robust outperformance over the
listed markets, outpacing the ASX 300 Index by +5.2% to +6.1% and the ASX
Small Ordinaries Index by +4.8% to +10.0% on a public market equivalent
(mPME) basis. To measure mPME, Cambridge Associates compared private equity
performance to that of listed equities by hypothetically ‘investing’ in the
ASX 300 and the ASX Small Ordinaries at the same time and equivalent amount
as the private equity investments. While it is generally accepted that the
higher risk and illiquidity of private equity require it to generate
returns of +3% to +5% over listed markets over time, the local PE and VC
index has largely achieved this standard hurdle across periods.
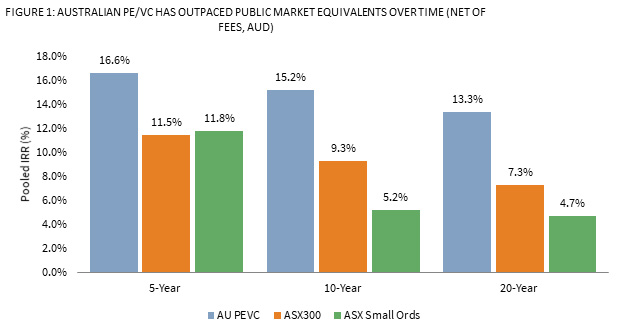
Source: Cambridge Associates Database, 30 June 2021, net of fees, expenses and carried interest. Returns presented in Australian Dollar terms.
Manager selection and the ability to access top performing managers
provided higher absolute returns net of fees and relative to the listed
markets. In the data gathered by Cambridge Associates, the top two
quartiles of Australian PE/VC funds have delivered 21.9% to 25.1%
annualized returns over 5-, 10-, and 20-year periods ending 30 June 2021.
This universe exceeded returns of the broader Australian PE/VC industry by
+6.7% to +8.8% per annum over time, while also outperforming the ASX 300
Index by +12.6% to +14.8% and the ASX Small Ordinaries Index by +13.3% to
+17.4% on a public market equivalent (mPME) basis.
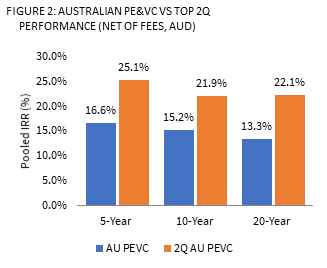
Source: Cambridge Associates Database, 30 June 2021, net of fees, expenses, and carried interest. Returns presented in Australian Dollar terms.
Australian PE/VC performance remains competitive among global peers over
time. On a local currency basis, with each region measured in its base
currency unless noted otherwise, Australian PE/VC returns exceeded US and
Asian PE/VC peers but lagged European PE/VC over the 20-year period (Figure
3). Over 5- and 10-year periods, Australian performance lagged US and
European PE/VC while outperforming Developed Asia PE/VC, reflecting local
market factors including interest rates, valuations, market depth and
sector exposures.
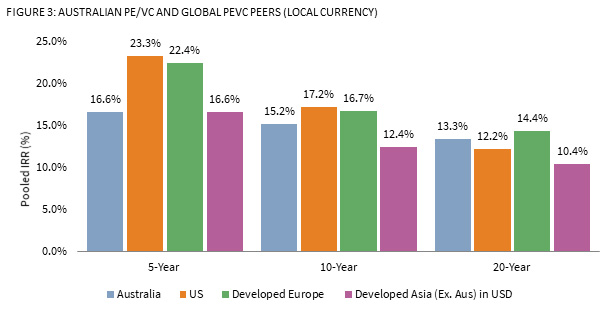
Source: Cambridge Associates Database, 30 June 2021, net of fees, expenses and carried interest. Returns presented in local currency terms.
Australian PE/VC as COVID Continues
The Australian PE/VC Index was up 52.9% over the trailing 1-year period to
30 June 2021, outperforming the ASX 300 and ASX Small Ordinaries by 24.5%
and by 19.6%, respectively (Figure 4). In the second quarter (ending 30
June), public markets made up for the slower start to the year with both
indices returning 8.5%. Besting these, the Australian PE/VC index returned
12.9% in the second quarter, extending its momentum after a strong first
quarter performance (+8.0%).
While it is useful to measure the industry’s cash flows over a quarterly or
12-month period to provide a snapshot of the recent market volatility, this
periodicity does not provide a meaningful performance indicator for a
long-term asset class. Private equity and venture capital performance is
measured over the medium to long-term (5- to 20-year periods) to align
performance with the strategy of acquiring and divesting investment assets.
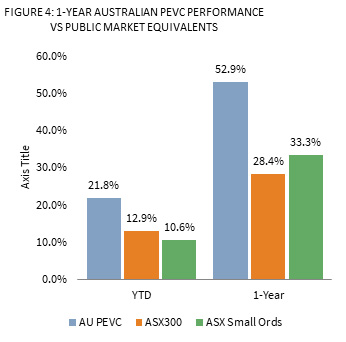
Source: Cambridge Associates Database, 30 June 2021, net of fees, expenses, and carried interest. Returns presented in Australian Dollar terms.
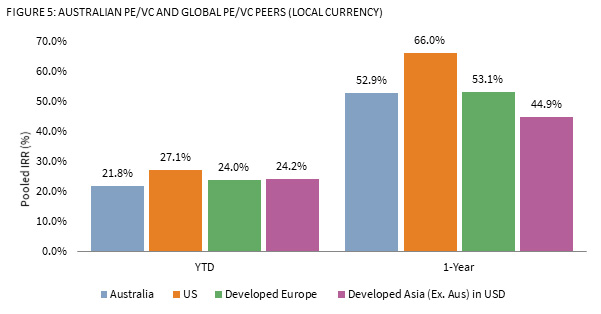
In line with global developed PE/VC peers, Australian PE/VC performance
remained robust throughout the year, though return dispersion across
regions contributed to varying results for the period. For the year-to-date
period, strong performance from the US resulted in its outperformance
versus global peers (including Australia), in local currency terms (Figure
5). Australian PE/VC had lower allocations to Information Technology
relative to the US who benefitted from the sector’s strong performance.
Australian PE/VC bested its Asian counterparts over the trailing 1-year
period, and was broadly in line with Europe PE/VC, demonstrating the
relative strength of Australian businesses and economy.
Source: Cambridge Associates Database, 30 June 2021, net of fees, expenses and carried interest. Returns presented in local currency terms.
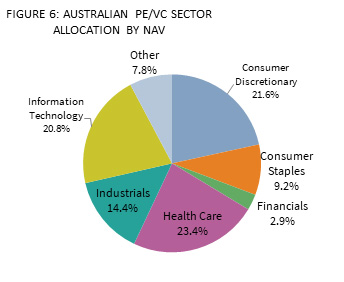
As of 30 June 2021, the Australian PE/VC index continued to be dominated by
four key sectors: Consumer, Healthcare, IT and Industrials (Figure 6). In
2Q21, the Australian PE/VC Index invested capital into Communication
Services, Consumer and Healthcare companies and realizations came from
companies in the Consumer, Healthcare, Industrials, IT and Materials
sectors.
Source: Cambridge Associates Database, 30 June 2021, gross of fees, expenses and carried interest.
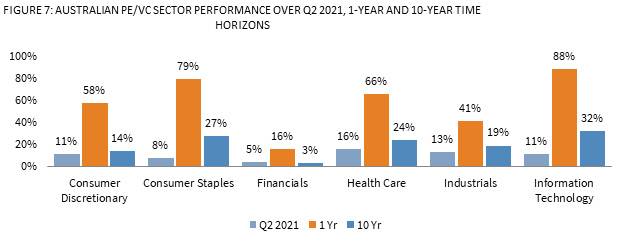
Australian PE/VC Index sector “winners” for the 1-year period ending 30
June included: IT, Consumer Staples and Healthcare (Figure 7), which all
contributed significant returns for the trailing 1-year. Financials turned
around after consecutive quarters of weaker performance, however, it
continued to trail the broader index. In Q2 2021, Consumer Staples and
Financials lagged other asset classes, while Industrials and Healthcare
have shown the strongest performance. While this year-to-date view provides
a reference to PE/VC performance during the period, it is a very short time
frame of data for strategies that typically manage investments with a
three- to seven-year holding period.
Source: Cambridge Associates Database, 30 June 2021, gross of fees, expenses and carried interest. Returns presented in Australian Dollar terms.
Australian PE/VC Looking Ahead
As Australia reemerges from the recent lockdowns across various states, it
is increasingly clear that the economy has remained resilient through the
pandemic, though increased consumer demand, global supply chain issues and
labour shortages are pushing inflation figures higher. While the RBA has
maintained its commitment to not hike interest rates until 2023, bond
markets have moved lower in anticipation of a possible change in the Bank’s
monetary stance. Private Credit assets that offer floating rate exposures
should continue to attract capital from institutional investors seeking
quality, defensive income assets. Similarly, alleviated listed market
valuations and the trend towards digitalization are also likely to continue
supporting the local PE & VC markets, both in terms of investor demand
and investment performance. As additional data builds via the Australian
PE/VC Index, Cambridge Associates will continue to measure the PE/VC
industry and reflect on the impacts to valuation, distributions and
investments in Australia and New Zealand.